Inverse Hierarchical Multi-Document Summarization
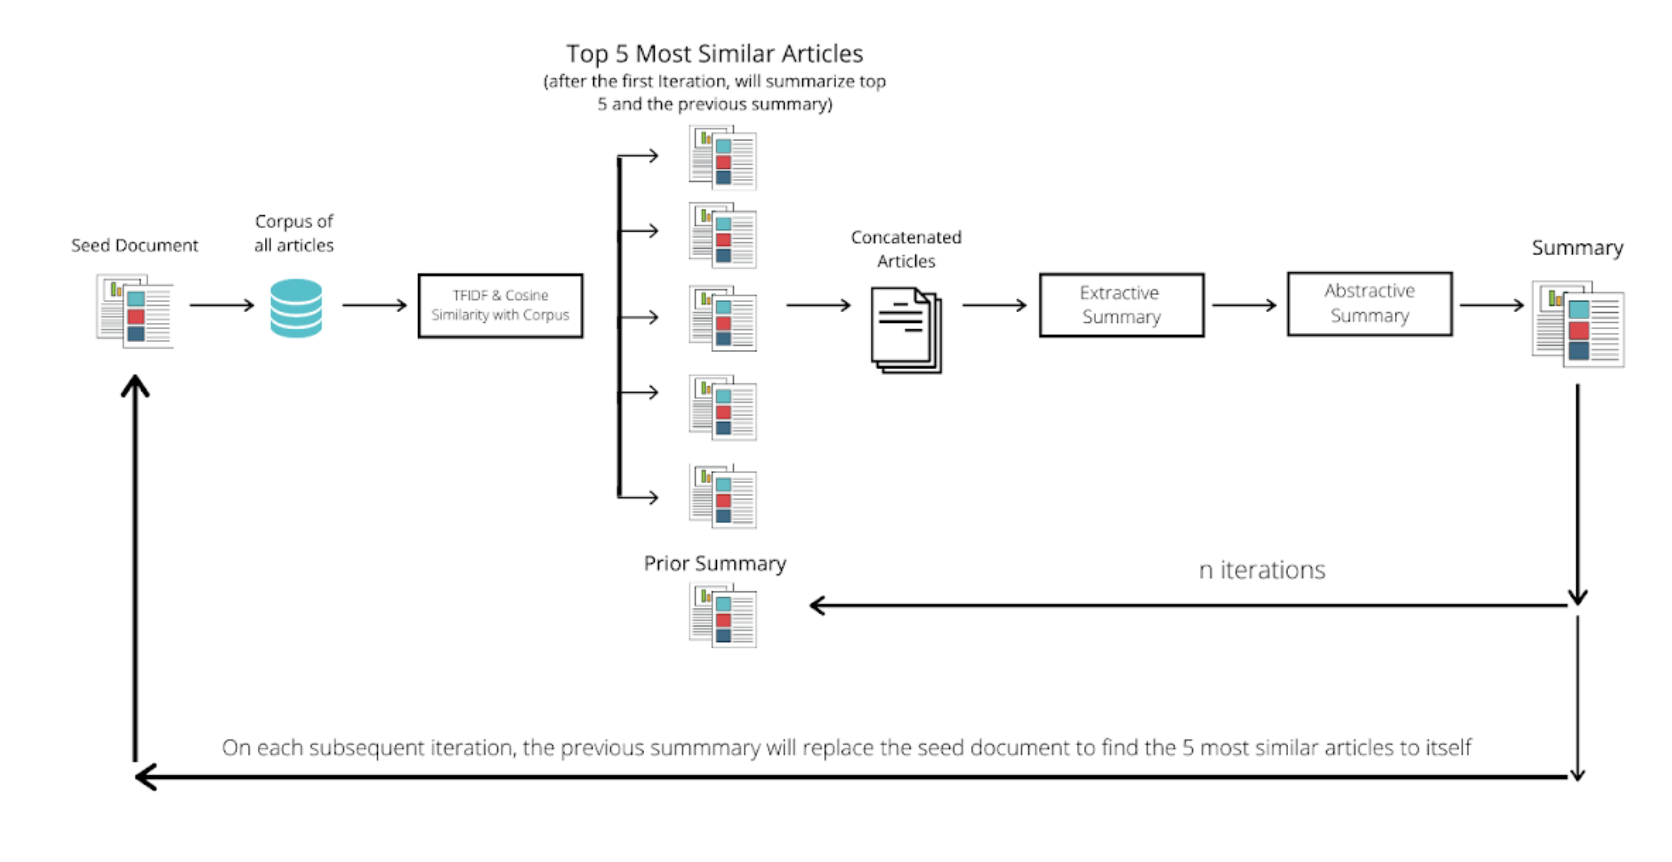
In this project, a team of 3 UC Berkeley MIDS students developed 2 novel model pipelines that perform inverse hierarchical multi-document summarization (MDS). We define inverse hierarchical multi-document summarization as the creation of a contextual summary that provides background information about any given news article text. This is the opposite of current hierarchical multidocument summarization, which provides a "drill down" approach for Multi-Document Summarization.
- Python, Tensorflow, Webscraping, APIs

Measuring User Productivity In Variable Foreground Contrast
To test for the causal effect of background contrast polarity on user productivity, an A/B test with a cohort size of 200+ individuals randomly assigned to 4 main groups (Light Mode, Dark Mode, Low Contrast, and Neon). User Productivity was operationalized to be the combination of reading comprehension, visual acuity, and pattern recognition. From the results of our A/B test, multivariate statistical tests were then performed to determine the statistical significance of an effect on user productivity. The resulting study results were corrected using the Bonferroni Correction to account for the multiple comparisons problem. We find a statistical significance at the 90% confidence level for an effect of low contrast background polarity on user productivity.
- Python, R, A/B Testing, Statistics, Experimentation and Causal Inference
Exploring Music Through Visualizations
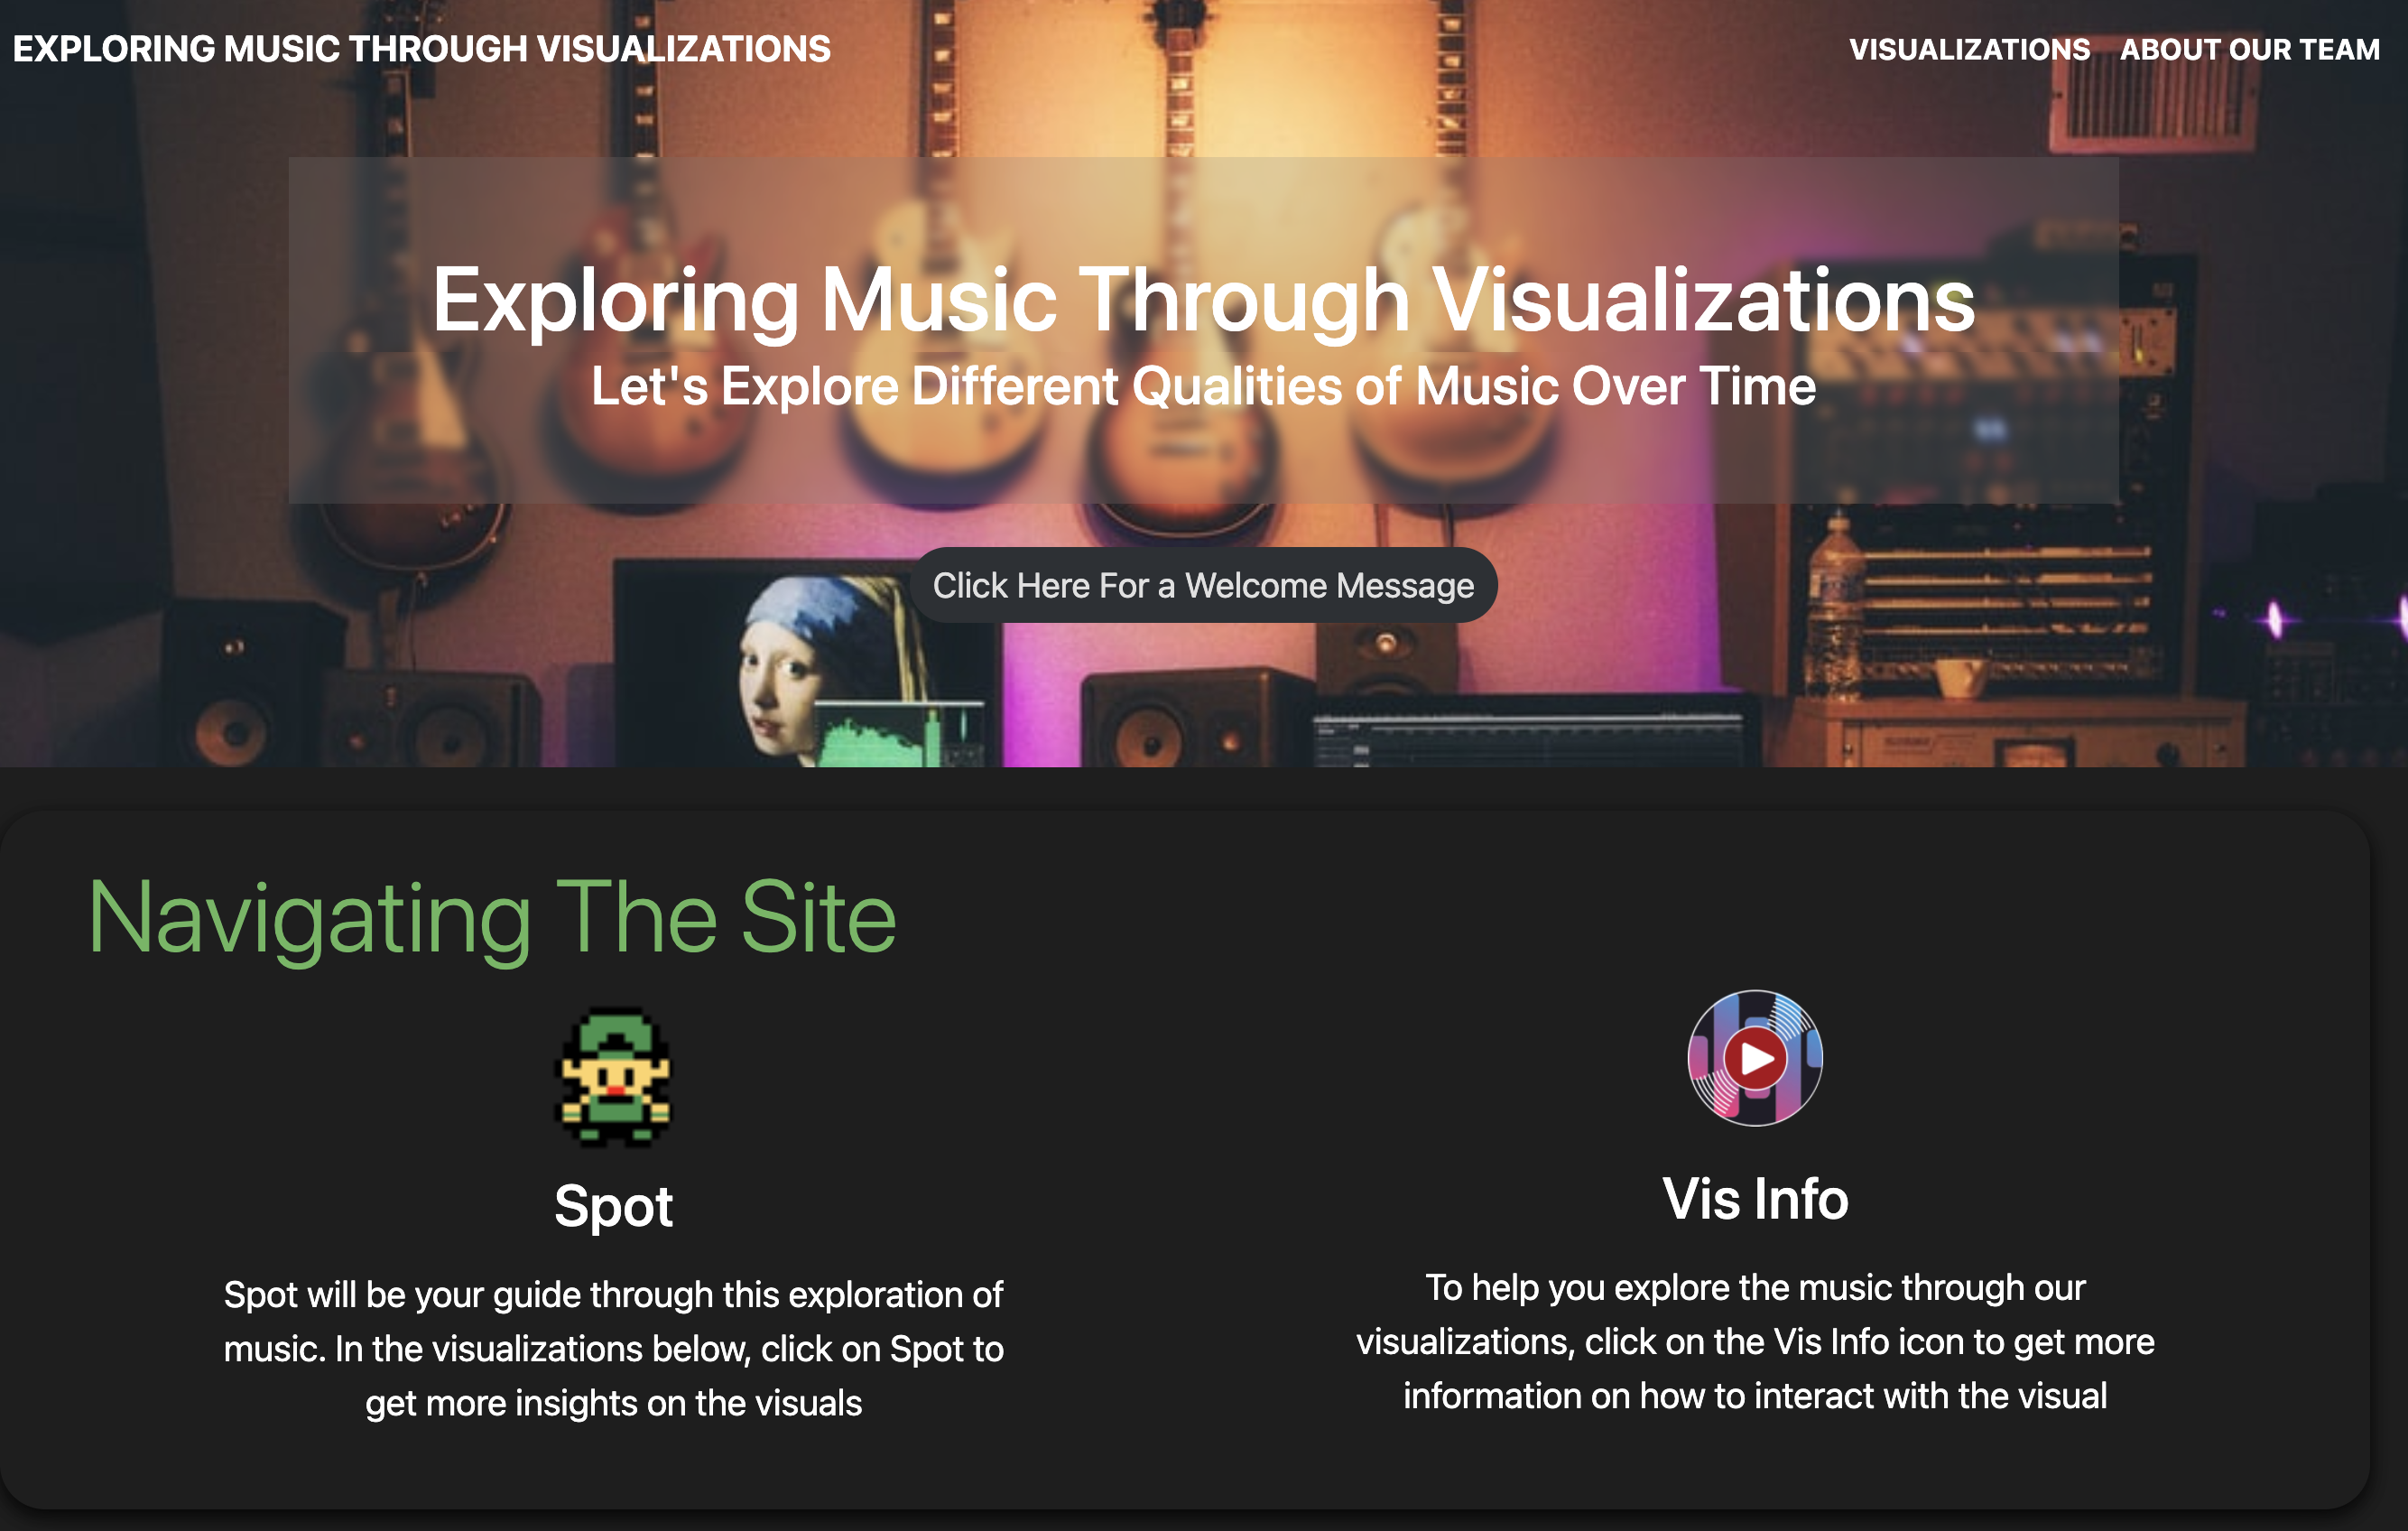
In this project, I scraped data of Global Top 200 Songs from SpotifyCharts.com to create visuals with my team to help audiences explore music popularity, qualities, and genres over time. Then, I worked with my group of 3 other UC Berkeley 5th Year MIDS team members to create a web app (hosted on vercel) for public audiences to view our visualizations.
- Python, Webscraping, Tableau, Javascript, HTML, CSS
Data Science Portfolio
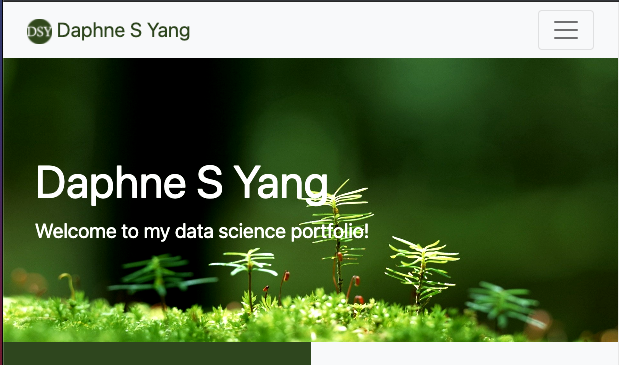
To better learn HTML and CSS in preparation for my Spring 2021 Data Visualization Class, I created my own portfolio website built upon a simple Bootstrap template and drawing inspiration from other portfolios published in Medium blog posts.
- HTML, CSS, Bootstrap, Adobe Dreamweaver

Lambda Architectrue Using Spark and HDFS: Tracking User Activity
In this project for my Data Engineering class, I am assuming the role at an ed tech firm. I've created a service that delivers assessments, and now lots of different customers (e.g., Pearson) want to publish their assessments on it. I need to get ready for data scientists who work for these customers to run queries on the data.
- Python, Docker, Kafka, Spark, HDFS

Lyft Bay Wheels Ridership Analysis
For this Data Engineering class project, I conducted an analysis on Lyft Bay Wheels ridership and and utilized Google Cloud Platform and Big Query to provide recommendations to increase ridership.
- SQL, Google Cloud Platform, Google Big Query, Jupyter Notebook